They Don't Know The Fannie Mae Home Purchase Sentiment Index® (HPSI) released this week jumped…
Lower Rates Will Not Last Long. PLUS Rent vs Buy Tool
[et_pb_section admin_label=”section”]
[et_pb_row admin_label=”row”]
[et_pb_column type=”4_4″][et_pb_text admin_label=”Text”]
[author] [author_image timthumb=’on’]https://www.theruethteam.com/wp-content/uploads/2020/11/testimonial_image.jpg[/author_image] [author_info]Nicole Rueth has been passionately advising clients on their wealth building and home financing strategies for over 17 years. Her path has been non-conventional and it is a benefit to her clients. www.TheRuethTeam.Com.[/author_info] [/author][/et_pb_text][/et_pb_column]
[/et_pb_row]
[/et_pb_section]
The Fed Rate Does NOT Equal Mortgage Rates
Did you miss Thursday’s market update? WOW, this last week had a months’ worth of data packed inside and to be honest, it wasn’t all good. In fact, in the wrong hands or headlines, it could look nasty. Throughout the entire week though, our mortgage rates kept going DOWN! Why?
The Personal Consumption Expenditures Price Index (PCE) hit the highest level since January 1982, rising 6.8%. Excluding food and energy it’s up 4.8%, up 0.1% from May. The Employment Cost Index, i.e. the cost of the workforce, was up 5.1% year over year, another record setting number. This came weeks after the Consumer Price Index (CPI), rose 9.1% year over year, the biggest gain since November 1981. Yet, no swings in the bond market… for either of these. Remember June? The CPI set the bond market into panic raising our 30-year mortgage rates from 5.49% to 6.5%. Then the PCE settled the market back to 5.5%. This month, the market’s didn’t react. We’ve settled in. Assuming inflation needs time to adjust. You know that in the difference between the headline and the core inflation numbers. Stripping out food and energy takes the 9.1% CPI down to 5.9% since the biggest cost contributors are food, energy and housing. Don’t get me wrong.. 5.9% is still HIGH and triple the Fed’s target of 2%.
So if inflation did not move the market what did? Mostly the European Central Bank (ECB) and the FED. The ECB is the central bank of the 19 European Union countries which use the Euro. They have one job… maintain price stability. That’s it. Just like Peter… one job. Yet.. how are they doing 😉
The ECB raised their Central Bank Rate from -0.5% to 0% last Friday kicking off what would be a series of reports showing the economy’s move towards slowing down. The week continued with data from the Leading Economic Index, Consumer Confidence, Walmart Earnings, New Home Sales, Pending Home Sales, GDP, Jobless Claims, the PCE and the Federal Reserve Meeting. If you want the details, make sure to watch Megan and me as we ripped through all things during the weekly market update here.
Ultimately the ECB and the FED both raised their Central Bank Rates and intend on doing so until inflation slows down. Powell does have two months to watch unemployment and inflation gauges until their September 21st meeting. In Powell’s words.. they went hard and fast and now need to let the market adjust.
Bottom line: the ECB’s 0.5% increase added to the Fed’s 0.75% raise, cooled off the bond market giving us a nice drop in rates from starting the week at 5.5% to ending the week at 5.125% national average. (Locally, I was locking in buyers at 4.625% to 4.99%) Don’t count on rates staying down as I think there is more volatility coming between here and the recession. This is just showing us what we can expect once we get there. Do you have buyers sitting on the sidelines? They need to jump in before volatile rates go back up and/or more buyers get the memo that rates declined and decide bidding over asking makes sense again!
Ouch! Rents Increase Sharply (Buy vs Rent Analysis)
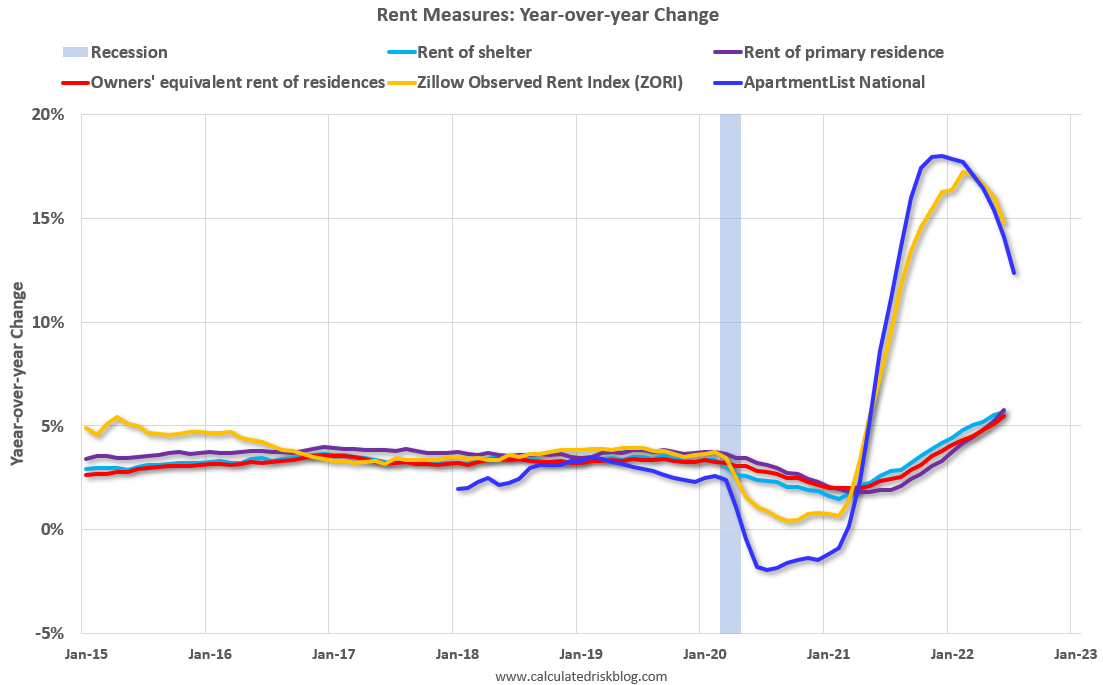
Rents continue to increase putting financial pressure on so many households trying to deal with inflation in everything from food to gas to clothing. Unlike a mortgage which is fixed, this month’s rent report shows when you are paying someone else’s mortgage, all bets are off. Zillow was up 14.8% YoY in June, down from its peak of 17.2% YoY in February.
The ApartmentList measure is up 12.4% YoY as of July, down from 14.1% in June. This is down from the peak of 18.0% YoY last December.
Clearly rents are still increasing, and we should expect it will continue to spill over into measures of inflation in 2022. The Owners’ Equivalent Rent (OER) was up 5.5% YoY in June, from 5.1% YoY in May – and will likely increase further in the coming months, keeping inflation high.
While rent increases will slow over the coming months as the pace of household formation slows, and more rental supply comes on the market, renters are still in a position of weakness when it comes to building wealth. Did you know, the average annual rent price increase dating back to 1980 is 8.86%? In Colorado, the median rent increased 32.48% from 2000 to 2020. Want more rental stats, check out this iProperty blog.
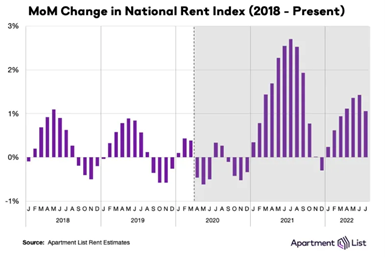
This graph reflects the slower but still high monthly rental increases. Nationally, rents rose 1.1% in July from June. In Denver rents increased 0.8%. So far this year, rents are growing more slowly than they did in 2021, but faster than they did in the years preceding the pandemic. The pain is real!
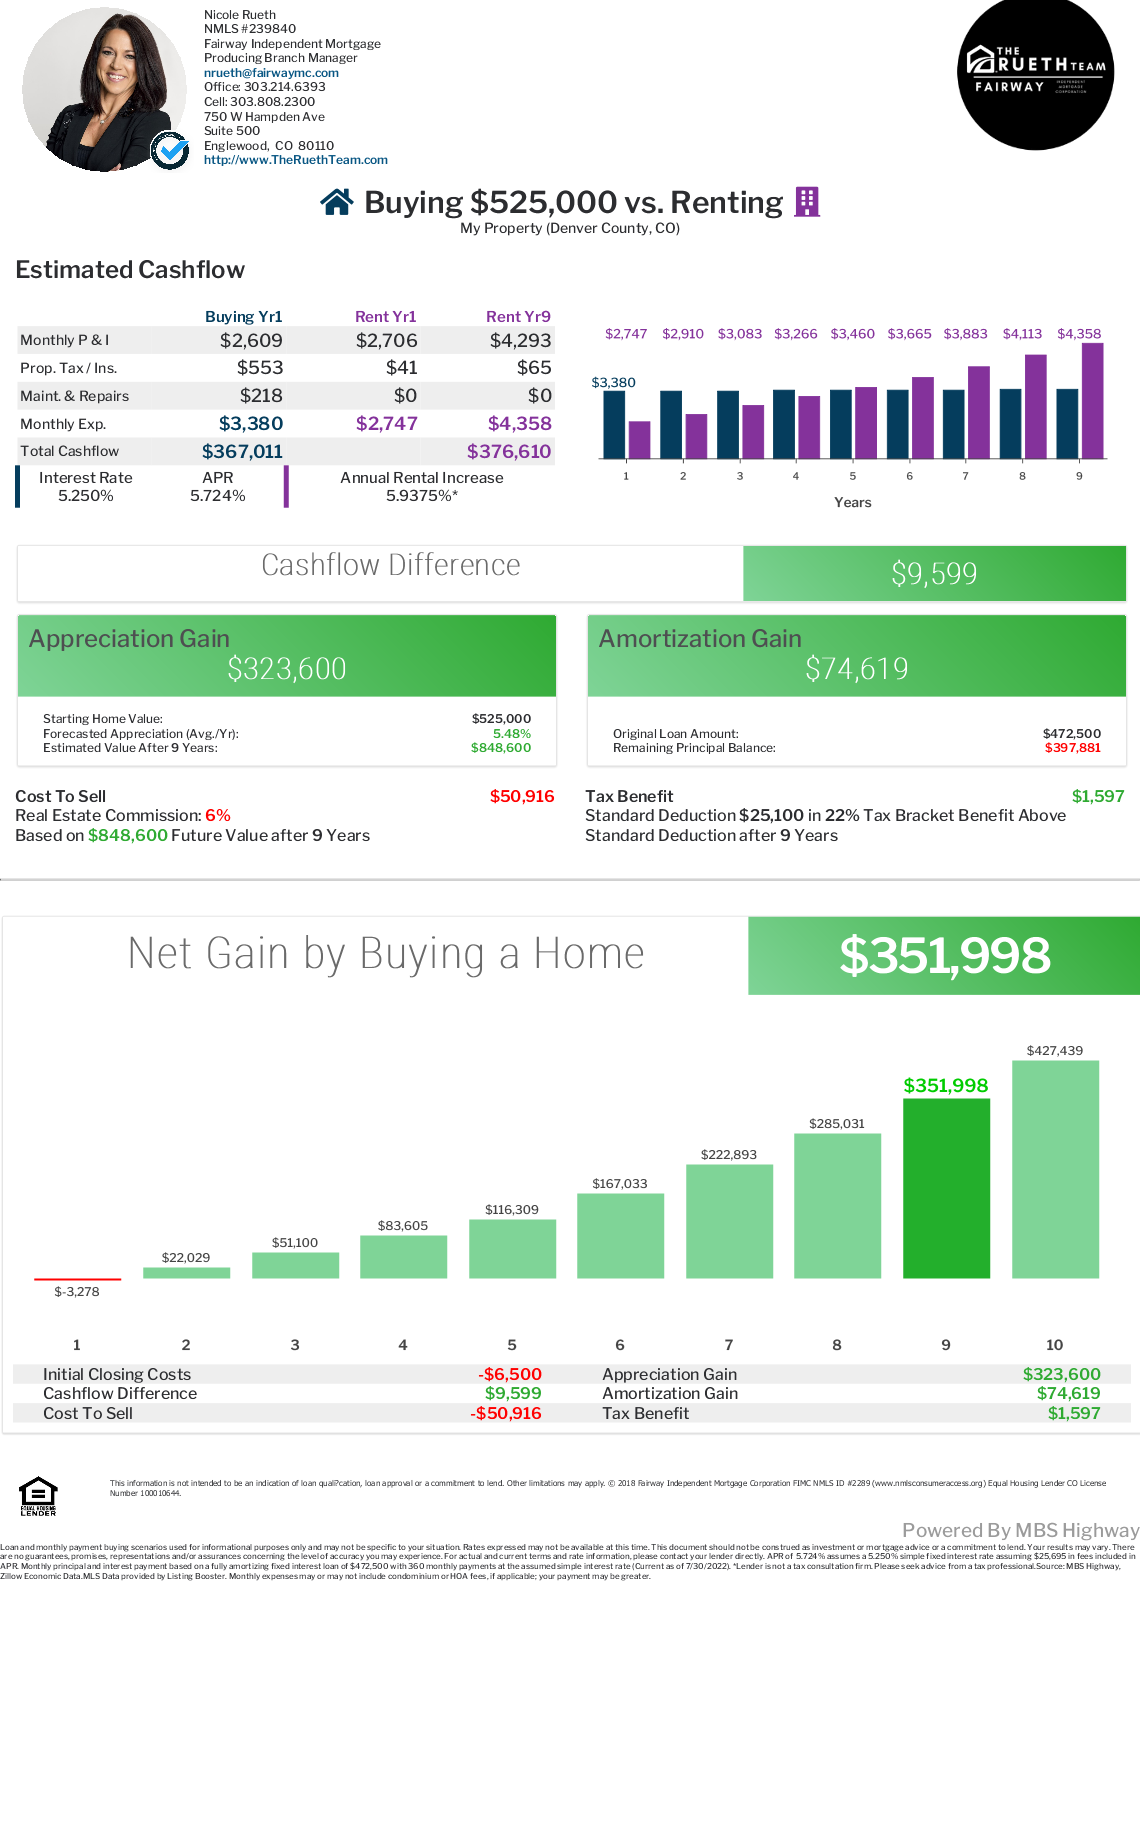
You know and I know, renting will put a roof over your head but does very little else for the financial health of Americans. I put together the Buy vs Rent Tool below showing the home my daughter bought for $525,000 and this little home’s market rent of $2706. Now… my daughter is renting 4 of the 5 bedrooms (we added a room) for $800 each. Total rent is $3,200 not $2706. So she’s almost living for free. This tool shows her estimated cost to own, including maintenance, is $3,380. Renting the whole house would cost a renter $2706. Over the course of 9 years, tenants would pay $376,033 (assuming an annual Denver average rental increase of 5.9%). $376,033 out the door with nothing to show for it.
My daughter on the other hand will have gained $351,422 in the same 9 years, using a conservative Denver annual appreciation of 5.48% plus principle reduction and tax advantages. Double click on that… she is now $351,422 richer compared to a renter is out a total of $376,033. Her $351,422 does not even include the additional principle reduction she would have by paying more down on the loan from rental income, it just assumes she continued to pay the mortgage on a 30-year amortization and spent the cash.
All in all.. it’s hard to argue against buying unless you really just like to move more often 😉
Want this tool for your want to be buyer? Just ask.. it takes me minutes to create!
How To Gain $150k In This Market: 29 New Listings Which Could Use A Little (or Lot) of Love
Buyers who have vision SAVE MONEY! I have a client who went under contract on one of the homes on the list last week. Under Contract for $425,000 adding $100,000 in renovations to get a FMV of $675,000… Now THAT’s how it’s done. Check out today’s list of 29 homes and get your creative juices flowing!
Related Posts