Rates Could and Probably Should Bounce Back Up
Only Time Will Tell
We’ve been talking about this CPI report (November report on October data) on our weekly market updates for months now. In fact, there may not be another future installment of economic data that we’ve ever focused on so intently so far in advance. But not only did CPI deliver, it OVERDELIVERED (and even that is an inadequate word to capture the grandeur). The CPI this week did two things in highlighting a trend reversal… it missed expectations AND had a significant drop. Expectations for this month’s month-over-month core CPI was 0.5%. Last years number was 0.6%. (see chart A) This month’s report came in with a core month-over-month of 0.3%. Headline also declined. What is big news inside the numbers is that unlike July’s drop, this time around fuel price data did not drive this move.
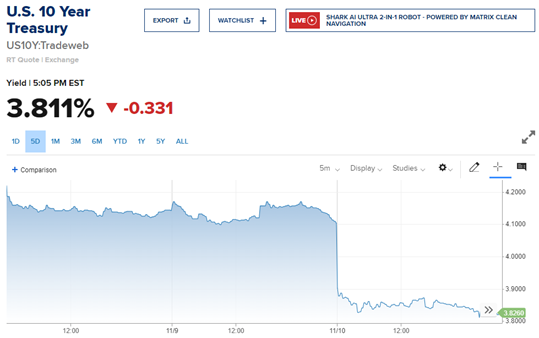
10yr yields dropped the most in a single day since 2009. (see chart B)
There were several factors in addition to the CPI report that helped drive a fast move. With a 3-day holiday impending, trading was lighter than normal. This 3-day holiday is also in November, which alone means less traders due to the holiday months where moves are often magnified due to lighter liquidity. So it doesn’t take as many trades to move the market. There were also a stack of trades waiting for higher rates now having to quickly buy to cover short trading positions.
So here’s the question: Was Thursday’s move indicative of a big shift in rates or a byproduct of the market conditions?
There is a plethora of numbers to watch for next week. The Producer Price Index will provide insight of the wholesale price inflation; the Empire State manufacturing survey will provide producer confidence; retail sales giving us clues as to the GDP strength; housing starts and NAHB homebuilder survey highlighting the housing market; and the weekly most important number to watch.. the jobless claims.
Thursday’s CPI report was a good one for the markets; but not enough to move the needle for the Fed’s yet.
It will take a minimum of two months to confirm a trend. Once the celebration is over, we will talk about whether this rally was a bit overdone and at risk of a correction, or confirmation of things to come.
Chart A – Month-over-Month Core Inflation
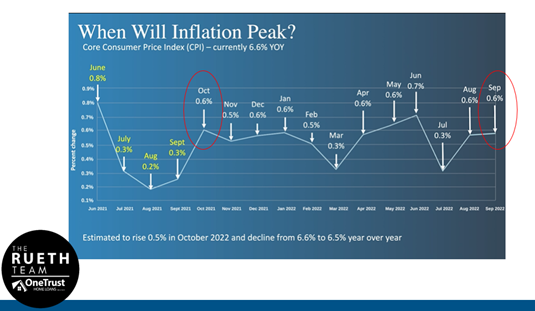
Chart B – The 10-Year Treasury’s drop on Thursday
Related Posts